| Year | No. of students placed (UG) | No. of students went for Higher Studies | % of placement | Highest Package (Lacs) |
|---|---|---|---|---|
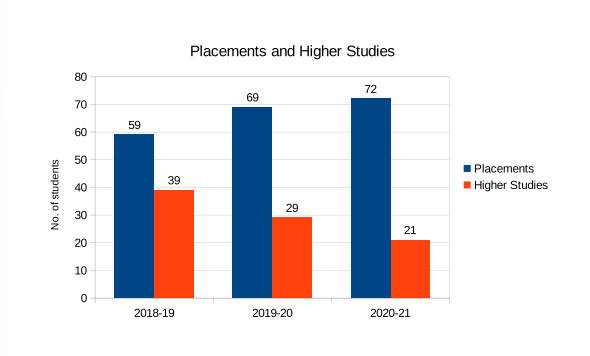
| 2018-19 | 59 | 39 | 63.44 | 25.33 |
| 2019-20 | 69 | 29 | 70.4 | 24.2 |
| 2020-21 | 72 | 21 | 73.46 | 43.31 |
| Year | Number of Companies Visited | Number of Students Placed | Number of Students went for higher studies | Percentage of Placement | Growth or Fall than Previous Year | Reason for Growth/ Fall | Highest Package (Lacs) | ||||
|---|---|---|---|---|---|---|---|---|---|---|---|
| UG | PG | UG | PG | ||||||||
| CS | VLSI | CS | VLSI | ||||||||
|
2008-2009 |
164 |
|
|
|
10 |
91.9 |
61.5 |
75 |
|
|
9 |
|
2009-2010 |
174 |
|
|
|
|
92.5 |
61.9 |
55.6 |
G/G/F |
|
11 |
|
2010-2011 |
209 |
|
|
|
|
95.8 |
78.3 |
95 |
G/G/G |
|
11.3 |
|
2011-2012 |
223 |
|
17 |
13 |
|
98.8 |
68 |
68.4 |
G/F/F |
|
11 |
|
2012-2013 |
224 |
80 |
9 |
10 |
1 |
88.9 |
42.9 |
52.6 |
F/F/F |
|
28 |
|
2013-2014 |
222 |
82 |
16 |
8 |
2 |
94.3 |
76.2 |
36.4 |
G/G/F |
|
32 |
|
2014-2015 |
64 |
73 |
19 |
14 |
2 |
84.9 |
79.17 |
82.35 |
F/G/G |
|
15 |
|
2015-2016 |
66 |
83 |
22 |
17 |
0 |
97.6 |
95.65 |
77.27 |
G/G/F |
|
17 |
|
2016-2017 |
77 |
78 |
25 |
20 |
0 |
100 |
92.6 |
100 |
G/F/G |
|
22 |
|
2017-2018 |
66 |
74 |
24 |
22 |
0 |
98.7 |
96 |
96 |
F/G/F |
|
22 |
|
2018-2019 |
34 |
59 |
|
16 |
43 |
98.3 |
87.5 |
95 |
F/F/F |
|
25.33 |
|
2019-2020 |
37 |
69 |
|
|
35 |
92 |
100 |
95.2 |
F/G/G |
|
24.2 |
|
2020-2021 |
46 |
72 |
|
|
27 |
88.9 |
88.9 |
100 |
F/F/G |
|
43.31 |
|
2021-2022 |
43 |
81 |
|
|
|
89 |
100 |
100 |
G/G/G |
|
40 |
| Year | 2010-11 | 2011-12 | 2012-13 | 2013-14 | 2014-15 | 2015-16 | 2016-17 | 2017-18 | 2018-19 | 2019-20 | 2020-21 | 2021-22 |
|---|---|---|---|---|---|---|---|---|---|---|---|---|
| Percentage |
78.3 |
68 |
42.9 |
76.2 |
79.2 |
95.7 |
92.6 |
96 |
87.5 |
100 |
88.9 |
100 |
| Year | 2010-11 | 2011-12 | 2012-13 | 2013-14 | 2014-15 | 2015-16 | 2016-17 | 2017-18 | 2018-19 | 2019-20 | 2020-21 | 2021-22 |
|---|---|---|---|---|---|---|---|---|---|---|---|---|
| Percentage |
95 |
68.4 |
52.6 |
36.4 |
82.4 |
77.3 |
100 |
95.7 |
95 |
95.2 |
100 |
100 |