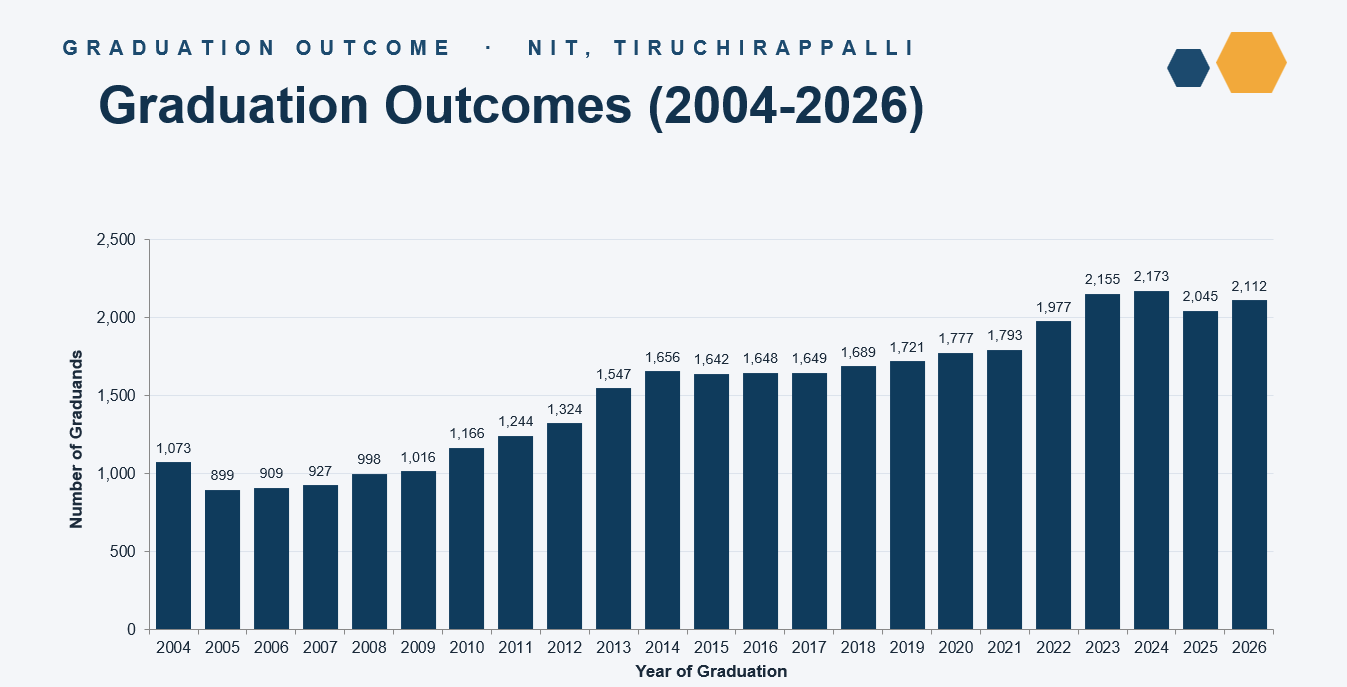
Number of Graduands (Total)
The total number of graduands of the National Institute of Technology Tiruchirappalli for each academic year is presented below, reflecting the Institute’s continued commitment to academic excellence and the development of competent graduates across various disciplines. The year-wise details list graduates who have successfully completed their undergraduate, postgraduate, and doctoral programmes and received degrees from the Institute. These records highlight the Institute’s academic legacy, growth, and contribution to higher education and research over the years.
|
Year |
B. Arch. |
B. Tech. |
M. Arch. |
M. Tech. |
M.Sc. (E) |
M.Sc. |
MCA |
MBA |
MA |
MS |
Ph.D. |
Total |
|
2004 |
21 |
653 |
- |
259 |
- |
25 |
61 |
54 |
- |
- |
- |
1073 |
|
2005 |
26 |
473 |
- |
246 |
- |
47 |
51 |
56 |
- |
- |
- |
899 |
|
2006 |
34 |
450 |
- |
266 |
- |
48 |
56 |
52 |
- |
- |
3 |
909 |
|
2007 |
28 |
470 |
- |
242 |
- |
47 |
58 |
58 |
- |
- |
24 |
927 |
|
2008 |
19 |
509 |
- |
286 |
- |
48 |
53 |
58 |
- |
1 |
24 |
998 |
|
2009 |
34 |
530 |
- |
247 |
- |
49 |
59 |
54 |
- |
3 |
40 |
1016 |
|
2010 |
30 |
548 |
- |
357 |
- |
62 |
60 |
68 |
- |
3 |
38 |
1166 |
|
2011 |
24 |
563 |
- |
378 |
- |
65 |
68 |
87 |
- |
5 |
54 |
1244 |
|
2012 |
33 |
689 |
- |
321 |
- |
61 |
84 |
80 |
- |
9 |
47 |
1324 |
|
2013 |
40 |
788 |
- |
428 |
- |
56 |
85 |
70 |
- |
21 |
59 |
1547 |
|
2014 |
57 |
829 |
- |
463 |
- |
79 |
79 |
82 |
- |
11 |
56 |
1656 |
|
2015 |
47 |
808 |
- |
444 |
- |
76 |
88 |
67 |
- |
30 |
82 |
1642 |
|
2016 |
51 |
850 |
- |
450 |
- |
72 |
86 |
57 |
- |
28 |
54 |
1648 |
|
2017 |
46 |
814 |
- |
444 |
- |
52 |
19 |
152 |
- |
37 |
85 |
1649 |
|
2018 |
46 |
855 |
15 |
422 |
- |
79 |
90 |
73 |
- |
21 |
88 |
1689 |
|
2019 |
51 |
812 |
18 |
468 |
- |
77 |
89 |
85 |
- |
23 |
98 |
1721 |
|
2020 |
38 |
803 |
17 |
489 |
- |
67 |
85 |
72 |
- |
33 |
173 |
1777 |
|
2021 |
44 |
831 |
23 |
444 |
- |
73 |
87 |
97 |
- |
20 |
174 |
1793 |
|
2022 |
38 |
881 |
21 |
572 |
- |
92 |
110 |
96 |
20 |
16 |
131 |
1977 |
|
2023 |
44 |
1090 |
22 |
538 |
- |
89 |
108 |
92 |
19 |
11 |
142 |
2155 |
|
2024 |
53 |
1054 |
25 |
523 |
- |
88 |
113 |
87 |
22 |
11 |
197 |
2173 |
|
2025 |
58 |
995 |
18 |
483 |
- |
90 |
109 |
95 |
17 |
5 |
175 |
2045 |
|
2026 |
60 |
1020 |
18 |
500 |
4 |
92 |
110 |
101 |
18 |
9 |
180 |
2112 |
|
Total |
922 |
17315 |
177 |
9270 |
4 |
1534 |
1808 |
1793 |
96 |
297 |
1924 |
35140 |